Image Details
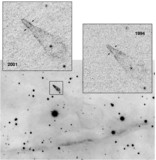
Caption: Fig. 3.
Power spectrum for electron density variations in the ISM, defined such that the integral over all wavenumbers is the mean‐square electron density. The region labeled "GN" designates the constraints derived from HST observations of the Guitar Nebula described here. The wavenumber range corresponds to the reciprocals of the length scales probed on angular scales between ~0﹩\farcs﹩05 and 1﹩\farcs﹩3, assuming a distance of 1.9 kpc and a combined filling factor and ionized fraction ranging from 0.02 to 0.5. The dashed line labeled "HI" is an estimate using the length scales of standard H I clouds (McKee & Ostriker 1977), assumed to be partially ionized. The line labeled "MSP" represents variations in dispersion measure for the millisecond pulsar B1937+21 (Cordes et al. 1990; Kaspi, Taylor, & Ryba 1994) The observational constraints at the highest wavenumbers result from measurements of interstellar scintillation and scattering. The point for Sgr A* represents the power level for scattering of the Galactic center source, corrected for the proximity of the scattering screen to the source (Lazio & Cordes 1998). The hatched regions incorporate constraints from scintillation and scattering observed for several hundred sources (NE2001; Cordes & Lazio 2002 and references therein). The light solid line designates a power spectrum with power‐law index equal to the Kolmogorov value (−11/3).
Other Images in This Article

Copyright and Terms & Conditions
© 2004. The American Astronomical Society. All rights reserved. Printed in U.S.A.