Image Details
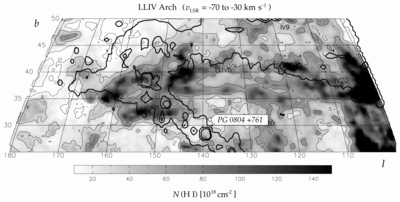
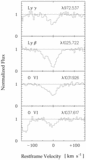
Caption: Fig. 1.
Gray‐scale and thin contours show the H I column density of the LLIV Arch (Kuntz & Danly 1996), in the velocity range between −70 and −30 km s﹩^{-1}﹩, from the Leiden‐Dwingeloo Survey (Hartmann & Burton 1997). Contour levels are at 1, 4, 8, and 16 ﹩\times 10^{19}﹩ cm﹩^{-2}﹩. Thick contours give brightness temperature levels of 0.05, 0.7, and 1.2 K for the high‐velocity gas (﹩v_{\mathrm{LSR}\,}﹩<−100 km s﹩^{-1}﹩) from the data of Hulsbosch & Wakker (1988). These approximately correspond to column densities of 0.25, 3, and 5 ﹩\times 10^{19}﹩ cm﹩^{-2}﹩.
Other Images in This Article

Copyright and Terms & Conditions
© 2001. The American Astronomical Society. All rights reserved. Printed in U.S.A.
Copyright ©
2025 Astronomy Image Explorer. All Rights Reserved.