Image Details
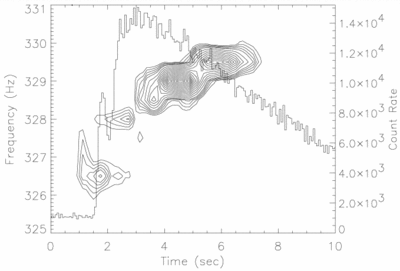
Caption: Fig. 4.
Dynamic power spectrum showing ≈330 Hz pulsations during a burst from 4U 1702−429. The contours denote loci of constant Fourier power as a function of frequency (left ordinate) and time. The individual power spectra were computed from 2 s intervals sampled at 1/8192 s time resolution, with a new interval beginning every 0.125 s. The PCA count rate vs. time is also shown (right ordinate). The power spectral contours were aligned on the center of each 2 s interval.
Other Images in This Article
Copyright and Terms & Conditions
© 1999. The American Astronomical Society. All rights reserved. Printed in U.S.A.
Copyright ©
2026 Astronomy Image Explorer. All Rights Reserved.