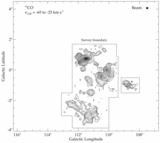
Image Details
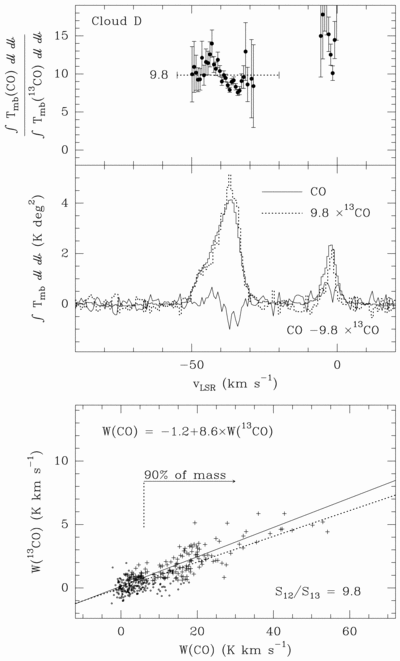
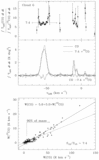
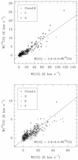
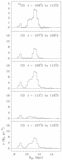
Caption: Fig. 4.
Relation between CO and ﹩^{13}﹩CO in (a) cloud G associated with NGC 7538 and (b) cloud D toward Cas A. For each cloud the top panel compares the spectra ﹩I=\int T_{\mathrm{mb}\,}dldb﹩ integrated over the face of the cloud. In the upper half, the CO/﹩^{13}﹩CO ratio with errors, the horizontal line indicates the ratio ﹩Q=S_{12}/ S_{13}﹩ of the total luminosities. In the lower half, ﹩I( \mathrm{CO}\,) ﹩ is shown by the solid line histogram, ﹩QI( ^{13}\mathrm{CO}\,) ﹩ by the dashed histogram, and the "residual" ﹩I( \mathrm{CO}\,) -QI( ^{13}\mathrm{CO}\,) ﹩ by the solid line. The lower panels show the pixel‐by‐pixel relation between the intensities integrated over velocity W; data above the estimated noise levels are indicated by larger symbols, data below the noise by tiny circles; the solid line is the best linear fit to data above the noise, and the dashed line has a slope ﹩1/ Q﹩; the arrow indicates the range of ﹩W( \mathrm{CO}\,) ﹩ that contributes 90% to the CO luminosity and cloud mass.
Other Images in This Article
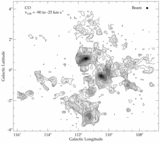

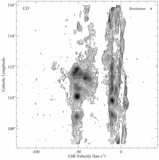
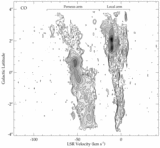
Show More
Copyright and Terms & Conditions
© 2000. The American Astronomical Society. All rights reserved. Printed in U.S.A.