Image Details
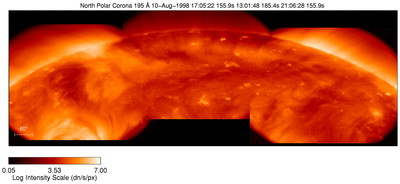
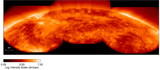
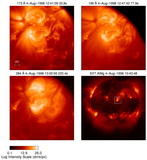
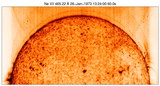
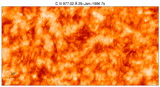
Caption: Fig. 1.
Mosaic of two TRACE images at and on both sides of the north solar pole. The images are displayed in a logarithmic intensity scale. (a) Images in the wavelength band centered at 173 Å; (b) image in the wavelength band centered at 195 Å. Color versions of these figures appear in the online edition of the Astrophysical Journal.
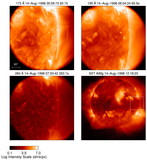
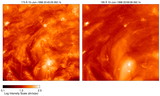
Other Images in This Article
Copyright and Terms & Conditions
© 1999. The American Astronomical Society. All rights reserved. Printed in U.S.A.
Copyright ©
2025 Astronomy Image Explorer. All Rights Reserved.