Image Details
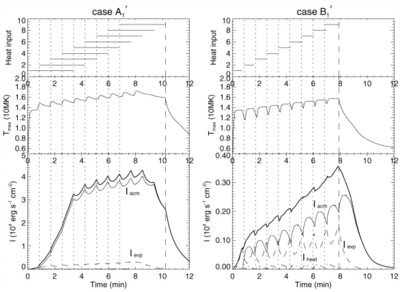
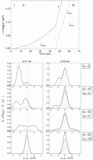
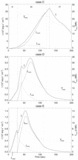
Caption: Fig. 8.
Multiple‐loop models for (a) Δt = 51 s and (b) Δt = 17 s. Top panels: Diagrams of flare heat input into the nine loops. Middle panels: Time variations of the maximum temperature. Bottom panels: Light curve of the Ca XIX w line. The dash‐dotted, dashed, and thin solid lines correspond to directly heated (Iheat), evaporated (Ievp), and accumulated (Iacm) components, respectively. The thick solid line is the sum of these components. The vertical dotted lines mark times when the heat input starts in individual loops, and the vertical dashed line represents when the final heat input terminates.
Other Images in This Article
Show More
Copyright and Terms & Conditions
© 1998. The American Astronomical Society. All rights reserved. Printed in U.S.A.