Image Details
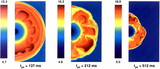
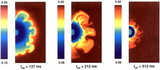
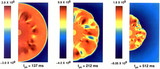
Caption: Fig. 3.
(a) Two‐dimensional entropy plots showing the evolution of neutrino‐driven convection in our 15 M☉ model, at 137, 212, and 512 ms after bounce. (b) Plots of the angle‐averaged entropy for the three entropy snapshots shown in (a). Also shown for comparison are the corresponding entropy profiles from our one‐dimensional simulation.
Other Images in This Article
Show More
Copyright and Terms & Conditions
© 1998. The American Astronomical Society. All rights reserved. Printed in U.S.A.
Copyright ©
2025 Astronomy Image Explorer. All Rights Reserved.