Image Details
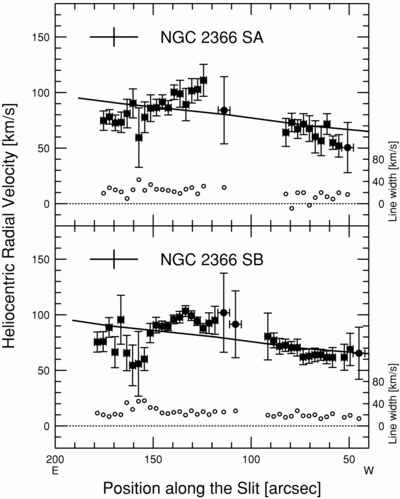
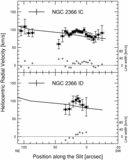
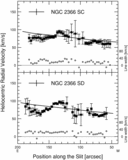
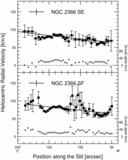
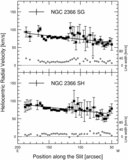
Caption: Fig. 2.
Position‐velocity diagrams for NGC 2366. Sixteen panels are presented, and the slit position names are labeled at the top of each panel. The abscissa indicates the position along the slit in arcseconds, and the coordinates of the origin are listed in Table 4. The ordinate indicates the heliocentric radial velocity and the FWHM of the Hα emission line. A filled circle indicates the central velocity of the line, and an open circle indicates the FWHM of the line. The scales for the central velocity and the FWHM of the line are shown by the left‐hand and right‐hand ordinates, respectively. The horizontal and vertical error bars on a filled circle show the binning width and the error of measurement of the central velocity, respectively. The instrumental broadening is reduced from the observed line width to derive the FWHM. The dotted line shows the 0 km s−1 level for the FWHM. The solid line indicates the H I velocity. The data are taken from Wevers et al. (1986). The cross in the top left‐hand corner of the panel shows the accuracy of the H I observations. The full length of the horizontal line of the cross, 24﹩\arcsec﹩, indicates the FWHM of the beam for the H I isovelocity map. For four positions of NGC 2366 IA to ID, the FWHM is 25﹩\arcsec﹩, since the size of the beam depends on the position angle. The half‐length of the vertical line of the cross, 8.25 km s−1, indicates the channel spacing of the H I observations.
Other Images in This Article

Show More
Copyright and Terms & Conditions
© 1998. The American Astronomical Society. All rights reserved. Printed in U.S.A.