Image Details

Caption: Figure 6.
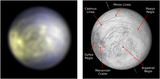
Normalized 1.50 μm/1.36 μm spectral ratio for SPHERE and NIMS observations. The NIMS data are a combination of the data sets in Table 2; in regions where the observations overlap, the median reflectance value is used. Blue areas in the map indicate stronger absorption at 1.50 μm, generally implying a higher water-ice abundance, and red areas indicate reduced water-ice abundance. The graph on the left shows reflectance spectra for a range of water-ice grain sizes (darker lines indicate smaller ice grains; see Figure 8) normalized to unity at 1.36 μm. The choice of ratio wavelengths measures the full relative depth of the 1.5 μm absorption and produces a map ratio that is mainly affected by ice abundance (rather than grain size).
Other Images in This Article


Show More
Copyright and Terms & Conditions
© 2022. The Author(s). Published by the American Astronomical Society.