Image Details

Caption: Figure 13.
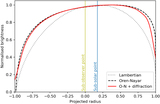
Spatial distribution of sulfate salt abundances. The top rows show best-estimate abundances (median of posterior distribution), and the bottom rows show the 1σ lower bound of the posterior abundance distributions. Lower bounds close to zero suggest that the specific endmember cannot be confidently detected. Abundance values less than 0.5% are shown in black. Note the different abundance scale for each salt species.
Other Images in This Article


Show More
Copyright and Terms & Conditions
© 2022. The Author(s). Published by the American Astronomical Society.
Copyright ©
2025 Astronomy Image Explorer. All Rights Reserved.