Image Details

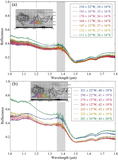
Caption: Figure 9.
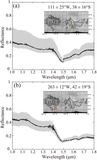
Results of our analysis of the noise level of the reflectance spectra at wavelengths of 1.150–1.255 μm. The observed areas on Europa are shown in the top insets. Close-up view of the reflectance spectra fitted by polynomial regression lines of a cubic function at (a) 111° ± 25°W, 38° ± 16°S, (b) 160° ± 9°W, 3° ± 15°N, and (c) 256° ± 5°W, 15° ± 14°N. Differences between the reflectance and polynomial regression lines of the reflectance as a function of wavelength at (d) 111° ± 25°W, 38° ± 16°S, (e) 160° ± 9°W, 3° ± 15°N, and (f) 256° ± 5°W, 15° ± 14°N. The 1σ noise levels are calculated at 1.79 × 10⁻³, 2.39 × 10⁻³, and 3.04 × 10⁻³, respectively.
Other Images in This Article


Show More
Copyright and Terms & Conditions
© 2022. The Author(s). Published by the American Astronomical Society.