Image Details
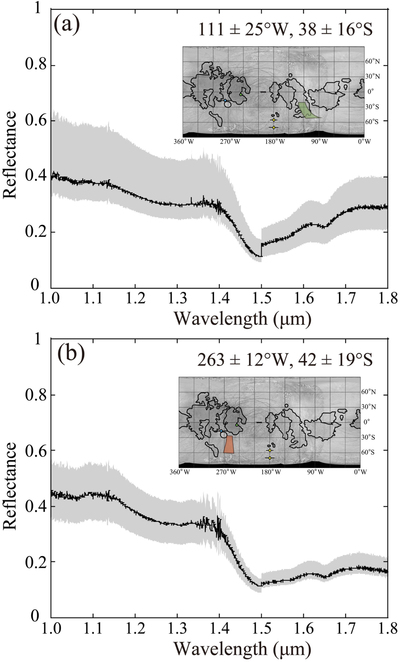
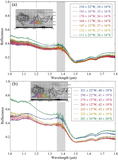
Caption: Figure 6.
Typical reflectance spectra of Europa’s surface. Each curve shows spectra of one area (shown as colored regions in the upper right insets). (a) Data for the southern regions in the leading hemisphere observed on 2019 May 17. (b) Data for the southern regions in the trailing hemisphere observed on 2019 May 18. The black curves were obtained using Equation (1). Gray areas represent the uncertainty in the absolute value of the reflectance due to the uncertainties in the photometric correction factors, cos(i), and differences in the observing conditions of the G2V stars (see Section 2.3). The reflectance spectra can be shifted within the gray areas; however, the spectral features do not change.
Other Images in This Article


Show More
Copyright and Terms & Conditions
© 2022. The Author(s). Published by the American Astronomical Society.