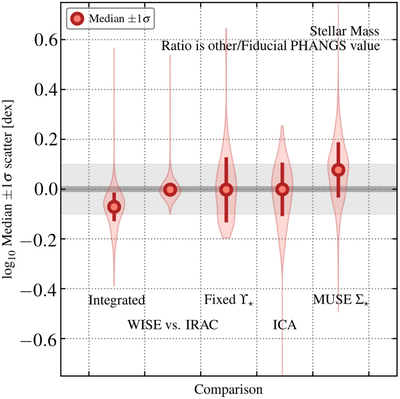
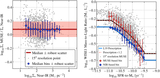
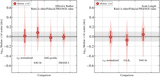
Image Details

Choose export citation format:

PHANGS–ALMA: Arcsecond CO(2–1) Imaging of Nearby Star-forming Galaxies

  • Authors: Adam K. Leroy, Eva Schinnerer, Annie Hughes, Erik Rosolowsky, Jérôme Pety, Andreas Schruba, Antonio Usero, Guillermo A. Blanc, Mélanie Chevance, Eric Emsellem, Christopher M. Faesi, Cinthya N. Herrera, Daizhong Liu, Sharon E. Meidt, Miguel Querejeta, Toshiki Saito, Karin M. Sandstrom, Jiayi Sun, 嘉 懿 孙, Thomas G. Williams, Gagandeep S. Anand, Ashley T. Barnes, Erica A. Behrens, Francesco Belfiore, Samantha M. Benincasa, Ivana Bešlić, Frank Bigiel, Alberto D. Bolatto, Jakob S. den Brok, Yixian Cao, Rupali Chandar, Jérémy Chastenet, I-Da Chiang, 宜 達 江, Enrico Congiu, Daniel A. Dale, Sinan Deger, Cosima Eibensteiner, Oleg V. Egorov, Axel García-Rodríguez, Simon C. O. Glover, Kathryn Grasha, Jonathan D. Henshaw, I-Ting Ho, Amanda A. Kepley, Jaeyeon Kim, Ralf S. Klessen, Kathryn Kreckel, Eric W. Koch, J. M. Diederik Kruijssen, Kirsten L. Larson, Janice C. Lee, Laura A. Lopez, Josh Machado, Ness Mayker, Rebecca McElroy, Eric J. Murphy, Eve C. Ostriker, Hsi-An Pan, Ismael Pessa, Johannes Puschnig, Alessandro Razza, Patricia Sánchez-Blázquez, Francesco Santoro, Amy Sardone, Fabian Scheuermann, Kazimierz Sliwa, Mattia C. Sormani, Sophia K. Stuber, David A. Thilker, Jordan A. Turner, Dyas Utomo, Elizabeth J. Watkins, Bradley Whitmore

Adam K. Leroy et al 2021 The Astrophysical Journal Supplement Series 257 .

  • Provider: AAS Journals

Caption: Figure 9.

Comparisons among stellar mass estimates. Median (point), ±1σ scatter (error bar), and distribution (shaded violin plot) for the ratios of stellar mass estimated in various ways. In each case, we consider the ratio of our adopted estimate, which uses IRAC- or WISE-based near-infrared data and a radially varying mass-to-light ratio estimated following Equation (3), to some other estimate. From left to right we show “Integrated” as comparison between our estimates and those from Leroy et al. (2019) using only integrated photometry, and “WISE vs. IRAC” comparing results using IRAC vs. WISE and treating the data identically. The results are highly consistent except for a few outliers. Next, “Fixed ﹩{{\rm{\Upsilon }}}_{\star }^{3.4}﹩” shows results using only WISE1 intensity with no varying mass-to-light ratio. “ICA” uses independent component analysis−based “old stellar emission” maps from Querejeta et al. (2015) with a fixed mass-to-light ratio. “MUSE Σ” is the 15″ resolution comparison between our mass surface density estimates and PHANGS–MUSE spectral fitting results, available for a subset of targets. The gray line and shaded region show perfect agreement and ±0.1 dex scatter. See also Table 5.

Other Images in This Article

Show More

Copyright and Terms & Conditions

Additional terms of reuse