Image Details
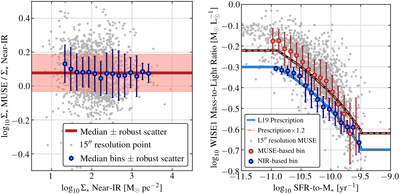
Caption: Figure 8.
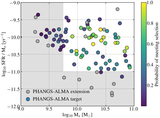
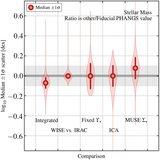
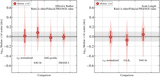
Stellar mass estimates and near-infrared mass-to-light ratios compared to results from PHANGS–MUSE. Comparison between our near-infrared-based stellar mass estimates and stellar masses based on full spectral fitting of PHANGS–MUSE data in the wavelength range 4850–7000 Å for 19 targets (Emsellem et al. 2021). The left panel shows the ratio between MUSE-based Σ⋆ and near-infrared-based Σ⋆ at 15″ resolution. Gray points show individual lines of sight. Blue points show median and robustly estimated scatter for data binned by Σ⋆. The red line and shaded region show the overall median ratio of ∼0.08 dex, i.e., a factor of 1.2, with about ±0.1 dex ≈ ±30% scatter. The right panel shows the near-infrared mass-to-light ratio, ﹩{{\rm{\Upsilon }}}_{\star }^{3.4}﹩, as a function of local specific star formation rate, SFR/M ⋆, estimated at 15″ resolution. Individual gray points show the ﹩{{\rm{\Upsilon }}}_{\star }^{3.4}﹩ implied by the MUSE fitting. Red and blue points with error bars show the binned ﹩{{\rm{\Upsilon }}}_{\star }^{3.4}﹩ in the region with MUSE coverage for our near-infrared data (blue) and implied by MUSE (red, binning the gray points). Lines show the adopted ﹩{{\rm{\Upsilon }}}_{\star }^{3.4}﹩ prescription from Leroy et al. (2019) and a version scaled by 1.2×, which describes the binned MUSE data reasonably well. Our fiducial stellar masses follow the blue line showing the Leroy et al. (2019) prescription in order to retain the link to the SDSS via Salim et al. (2016, 2018).
Other Images in This Article
Show More
Copyright and Terms & Conditions
© 2021. The American Astronomical Society. All rights reserved.