Image Details
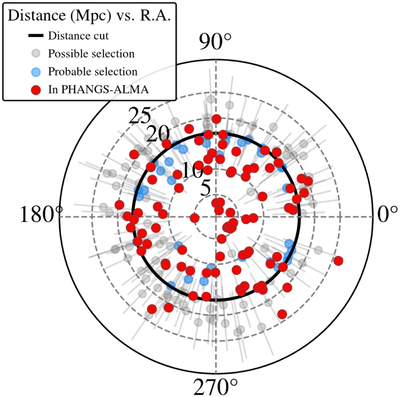
Caption: Figure 6.
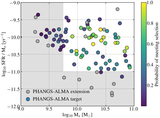
Sample selection and location. Right ascension and current best-estimate distance of PHANGS–ALMA targets (red points) and candidate targets that we did not select (blue and gray points). The overdensity of points toward 180° reflects the presence of the Virgo cluster. Blue points show targets close to meeting our selection criteria at their present distance; given the uncertainty in their stellar mass, SFR, and inclination we estimate that they are ≳50% likely to meet our selection criteria. Gray points show galaxies where, given the uncertainty in distance, the targets are between 50% and 10% likely to have true values that meet our selection criteria. Red points show the actual PHANGS–ALMA sample. The dashed gray concentric circles indicate distances of 5, 10, 20, and 25 Mpc; our distance cutoff at 17 Mpc is indicated with a thick black line. Our selection did a good job of picking out all good candidates within ≲10 Mpc. The well-known uncertainties in distances to nearby galaxies leads to uncertainty in the selection near our distance cutoff. Figure 5 gives another view of the uncertainty in selection.
Other Images in This Article
Show More
Copyright and Terms & Conditions
© 2021. The American Astronomical Society. All rights reserved.