Image Details
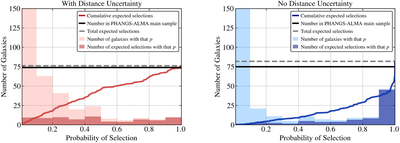
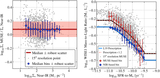
Caption: Figure 5.
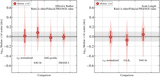
Sample selection expectations and uncertainties based on a Monte Carlo calculation. Histograms show the number of galaxies as a function of the probability that they meet the main PHANGS–ALMA sample selection criteria. We take the physical property estimates and associated uncertainties for ∼15,000 local galaxies from Leroy et al. (2019) as “true.” Then we repeatedly realize random versions of galaxy properties to estimate the probability of selecting each galaxy. The left panel includes uncertainties on distance, the right panel considers only uncertainties on stellar mass, star formation rate, and inclination. Light histograms show the total number of galaxies with that probability of selection. Dark histograms show the number of galaxies that we would expect to select from that bin based on these probabilities. The (red/blue) solid and gray dashed lines show the resulting cumulative distribution function and total expected number of selected galaxies. The solid black line shows the actual number of galaxies (75) selected for the PHANGS–ALMA main sample. Our sample contains roughly the expected number of galaxies, but once distance uncertainties are accounted for there is substantial uncertainty associated with the exact selection (see also Figure 6).
Other Images in This Article
Show More
Copyright and Terms & Conditions
© 2021. The American Astronomical Society. All rights reserved.