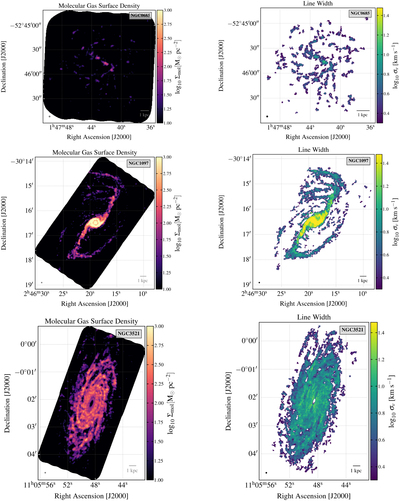
Image Details

Choose export citation format:

PHANGS–ALMA: Arcsecond CO(2–1) Imaging of Nearby Star-forming Galaxies

  • Authors: Adam K. Leroy, Eva Schinnerer, Annie Hughes, Erik Rosolowsky, Jérôme Pety, Andreas Schruba, Antonio Usero, Guillermo A. Blanc, Mélanie Chevance, Eric Emsellem, Christopher M. Faesi, Cinthya N. Herrera, Daizhong Liu, Sharon E. Meidt, Miguel Querejeta, Toshiki Saito, Karin M. Sandstrom, Jiayi Sun, 嘉 懿 孙, Thomas G. Williams, Gagandeep S. Anand, Ashley T. Barnes, Erica A. Behrens, Francesco Belfiore, Samantha M. Benincasa, Ivana Bešlić, Frank Bigiel, Alberto D. Bolatto, Jakob S. den Brok, Yixian Cao, Rupali Chandar, Jérémy Chastenet, I-Da Chiang, 宜 達 江, Enrico Congiu, Daniel A. Dale, Sinan Deger, Cosima Eibensteiner, Oleg V. Egorov, Axel García-Rodríguez, Simon C. O. Glover, Kathryn Grasha, Jonathan D. Henshaw, I-Ting Ho, Amanda A. Kepley, Jaeyeon Kim, Ralf S. Klessen, Kathryn Kreckel, Eric W. Koch, J. M. Diederik Kruijssen, Kirsten L. Larson, Janice C. Lee, Laura A. Lopez, Josh Machado, Ness Mayker, Rebecca McElroy, Eric J. Murphy, Eve C. Ostriker, Hsi-An Pan, Ismael Pessa, Johannes Puschnig, Alessandro Razza, Patricia Sánchez-Blázquez, Francesco Santoro, Amy Sardone, Fabian Scheuermann, Kazimierz Sliwa, Mattia C. Sormani, Sophia K. Stuber, David A. Thilker, Jordan A. Turner, Dyas Utomo, Elizabeth J. Watkins, Bradley Whitmore

Adam K. Leroy et al 2021 The Astrophysical Journal Supplement Series 257 .

  • Provider: AAS Journals

Caption: Figure 4.

Cloud scale molecular gas properties depend on host galaxy and location in the galaxy. PHANGS–ALMA CO(2−1)-based estimates of (left) molecular gas surface density, Σmol, and (right) effective line width, σ v , for three galaxies. All three galaxies are shown at the same physical resolution of 150 pc and using the same logarithmic color stretch. The galaxies show striking differences in their overall surface density and line width, the morphology of their gas distribution at 150 pc scales, and in the distributions of gas and line width within each galaxy. Note that the line width is only measured within pixels detected at high confidence, while the integrated intensity is estimated over an area selected for completeness. See Section 7 for details on the calculation individual maps and Section 8 for similar images of the whole sample.

Other Images in This Article

Show More

Copyright and Terms & Conditions

Additional terms of reuse