Image Details
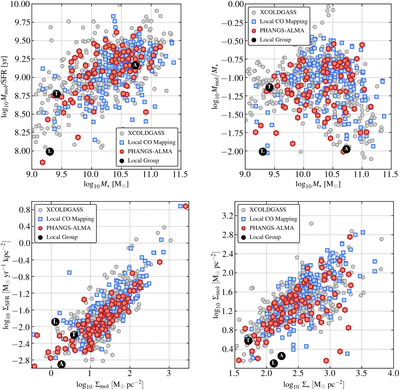
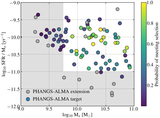
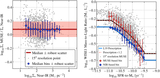
Caption: Figure 1.
Global trends in the molecular gas content of galaxies relative to their stellar masses and star formation rates. PHANGS–ALMA aims to link these global trends to local properties and local physics in the molecular gas. Each point in each panel shows an individual galaxy from PHANGS–ALMA (red), xCOLD GASS (gray; Saintonge et al. 2017), or previous generation CO mapping of local galaxies (blue; Kuno et al. 2007; Leroy et al. 2009; Sorai et al. 2019; A. Schruba et al. 2022, in preparation). The top left panel shows the ratio of molecular gas mass, M mol, to star formation rate (SFR) as a function of stellar mass, M ⋆. The top right panel shows the ratio of M mol to M ⋆ as a function of M ⋆. The bottom left panel shows the average SFR surface density, ΣSFR, within the half-light radius as a function of the molecular gas mass surface density, Σmol. The bottom right panel shows Σmol as a function of the average stellar surface density inside the half-light radius, Σ⋆. All four panels assume a fixed, Galactic CO-to-H2 conversion factor of α CO = 4.35 M ⊙ pc−2 (K km s−1)−1 (Bolatto et al. 2013a) and adopt a single CO (2–1)-to-CO (1–0) ratio, R 21 = 0.65 (Leroy et al. 2013b; den Brok et al. 2021) when needed. For local galaxies, we estimate SFR and M ⋆ using Wide-field Infrared Survey Explorer (WISE) mid-infrared and Galaxy Evolution Explorer (GALEX) UV data following Leroy et al. (2019). In the bottom two panels, we assume that the effective radius for stellar mass also represents the half-light radius for CO emission and SFR. For more details see Section 4. For reference we show three Local Group galaxies with previous GMC-scale CO mapping: the LMC (L), M31 (A), and M33 (T) in each panel (values from Nieten et al. 2006; Fukui et al. 2008; Druard et al. 2014; Jameson et al. 2016; Leroy et al. 2019).
Other Images in This Article
Show More
Copyright and Terms & Conditions
© 2021. The American Astronomical Society. All rights reserved.