Image Details
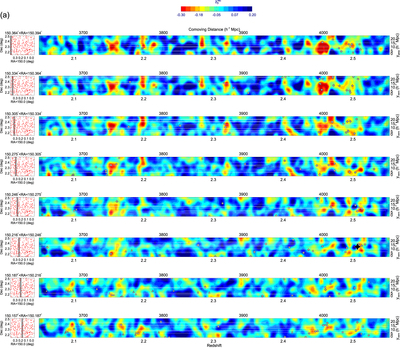
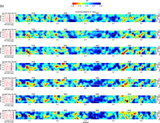
Caption: Figure 9.
Wiener-filtered tomographic reconstructions of the Lyα forest absorption field, ﹩{\delta }_{F}^{\mathrm{rec}}﹩, at ﹩2.05\lt {z}_{\alpha }\lt 2.55﹩ from the current CLAMATO data (color map), shown after smoothing with an isotropic ﹩R=2\,{h}^{-1}\,\mathrm{Mpc}﹩ Gaussian kernel. Each color panel shows the absorption projected over a ﹩2\,{h}^{-1}\,\mathrm{Mpc}﹩ R.A. slice, the position of which is denoted by the shaded region in the subpanels to the left that also show the sightline positions on the sky as red dots. The color convention for the absorption is such that red denotes overdensities, while blue denotes underdensities. White horizontal lines denote the sightline coverage, while symbols mark the location of known foreground galaxy redshifts: downward triangles for MOSDEF, upward triangles for ZFIRE, squares for VUDS, diamonds for zCOSMOS-Deep, and circles for CLAMATO. The large black stars indicate the reported central positions of the galaxy overdensities at ﹩z=[2.10,2.44,2.47,2.51]﹩. This sequence is continued in Figure 9(b).
Other Images in This Article
Show More
Copyright and Terms & Conditions
© 2018. The American Astronomical Society. All rights reserved.
Copyright ©
2024 Astronomy Image Explorer. All Rights Reserved.