Image Details
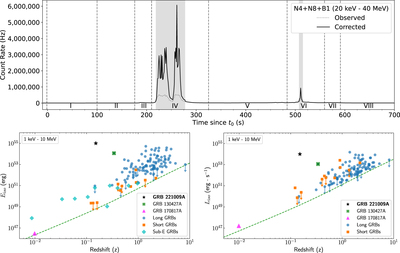
Caption: Figure 7.
Top: the light curve of GRB 221009A from 8 keV to 40 MeV before and after PPU correcting in the Fermi-GBM BTI regions. Bottom: short and long GRB E iso (left) and L iso (right) measures of Fermi-GBM-detected GRBs with known redshift values through 2017 (Abbott et al. 2017), with updated spectral measures from Poolakkil et al. (2021). Key GRBs are highlighted. The downward arrows indicate GRBs best fit by a PL spectral model, which must turnover somewhere, so they are shown as upper limits. The E iso plot is supplemented with low- or intermediate-luminosity GRBs with associated supernova from Cano et al. (2017). We do not utilize their luminosity measures as they are averaged (not peak).
Other Images in This Article


Copyright and Terms & Conditions
© 2023. The Author(s). Published by the American Astronomical Society.