Image Details
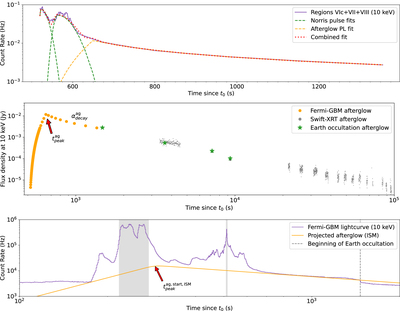
Caption: Figure 6.
Top: the light curve of GRB 221009A in regions VIc, VII, and VIII after fitting the spectra with a Band function and extrapolating down to 10 keV. The green dashed lines show Norris function fits to the prompt emission phase while the yellow dashed line shows a BPL fit to the afterglow phase. Middle: the flux density light curve of the afterglow (yellow dots) after removing the prompt emission flux from the Norris function pulses. Flux measurements with the Earth occultation technique are also shown by green stars and the gray points mark the Swift-XRT observations. Bottom: the full Fermi-GBM light curve at 10 keV fitted with the projected interstellar medium (ISM)-afterglow such that the afterglow emission does not exceed the prompt emission. The region to the right of the vertical dashed line (t 0 + 1464 s) marks the time when GRB 221009A was occulted by the Earth.
Other Images in This Article


Copyright and Terms & Conditions
© 2023. The Author(s). Published by the American Astronomical Society.