Image Details
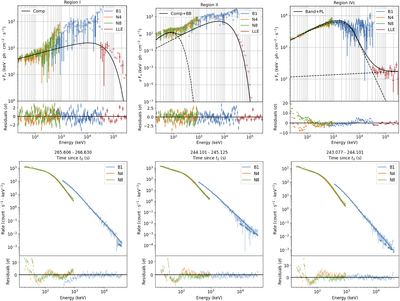
Caption: Figure 5.
Top: the νF(ν) spectra for region I best fit by a COMP model (left), the νF(ν) spectra for region II best fit by a COMP+BB model (middle), and the νF(ν) spectra for subregion IVc best fit by a Band+PL model (right). Bottom: average examples of counts spectrum plots during the Fermi-GBM BTI region of subinterval IVb (Left: t 0 + 243.1 s; middle: t 0 + 244.1 s; and right: t 0 + 265.6 s) achieved by using the PPU-correction method described in Section 3.1. The spike at 511 keV is ignored during the fitting process and does not affect the fit statistic.
Other Images in This Article


Copyright and Terms & Conditions
© 2023. The Author(s). Published by the American Astronomical Society.