Image Details

Caption: Figure 4.
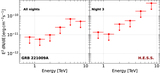
The H.E.S.S. 95% upper limits on Night 3 (red) are plotted along with the XRT (blue, 1σ) best-fit spectrum and LAT (purple, 95% C.L.) upper limit, as well as publicly available radio data from the Submillimeter Array (black open circle; Rhodes et al. 2022) and an optical flux (green square; extracted from Figure 2 of Fulton et al. 2023) in a multiwavelength SED. An example set of synchrotron and SSC emission components—arising from a single, partially cooled electron population described in Table 3—are also shown to illustrate a possible explanation of the multiwavelength observations.
Other Images in This Article

Copyright and Terms & Conditions
© 2023. The Author(s). Published by the American Astronomical Society.
Copyright ©
2025 Astronomy Image Explorer. All Rights Reserved.