Image Details
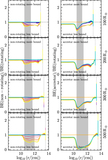
Caption: Figure 9.
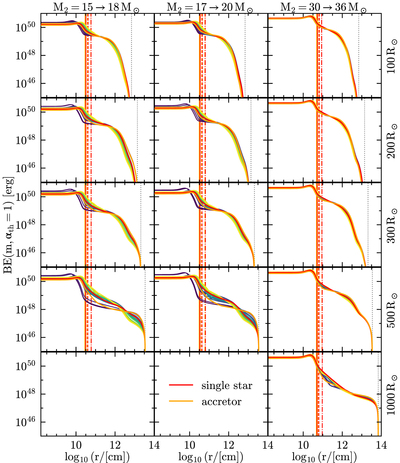
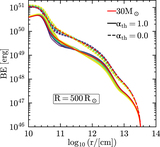
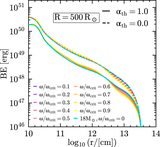
Binding energy profile at fixed photospheric radius R (right y-axis) as a function of radial coordinate r. We only show profiles with α th = 1, which is accounting for the internal energy content of the star. Orange, red, and other colors show, respectively, the accretor models, single stars of same post-RLOF total mass, and engineered models with varying CEB steepness (increasing CEB size from blue to yellow; see Figure 2). Titles indicates the pre-RLOF and approximate post-RLOF accretor masses. The vertical colored lines mark the outer edge of the helium cores of the accretor and single star, which is the outermost location where Y > 0.1 and X < 0.01 (solid lines), or X < 0.1 (dashed), or X < 0.2 (dotted–dashed). The dotted gray lines mark the total radius R of these models.
Other Images in This Article
Copyright and Terms & Conditions
© 2023. The Author(s). Published by the American Astronomical Society.