Image Details
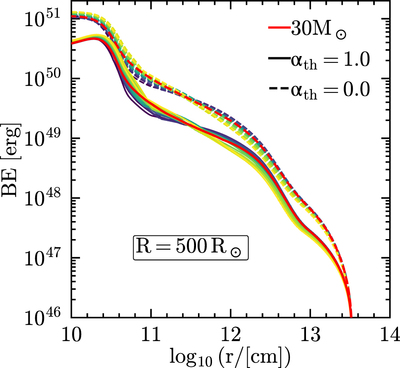
Caption: Figure 6.
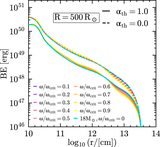
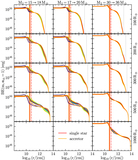
The structure of the CEB at the end of the main sequence impacts the envelope binding energy profile throughout the remaining evolution. Dashed lines show the gravitational contribution only; while solid lines include the contribution of the internal energy. The red lines show a 30 M ⊙, nonrotating, Z = 0.0019 model compared to “engineered” models of the same mass (see Figure 5, increasing CEB size from blue to yellow), but artificially imposed profile at TAMS (other colors; see text). The top (bottom) axis indicates mass coordinate (radius). We compare the models when they first reach 500 R ⊙.
Other Images in This Article
Copyright and Terms & Conditions
© 2023. The Author(s). Published by the American Astronomical Society.