Image Details
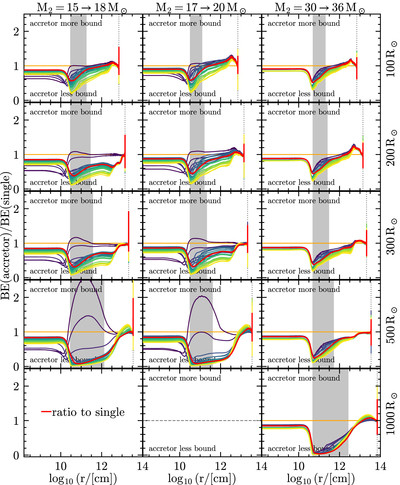
Caption: Figure 3.
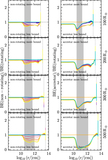
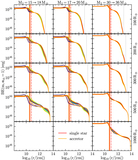
Ratios of the binding energy profiles (including internal energy, α th = 1) of the accretor stars divided the binding energy profile of stars of the same total mass post-RLOF. The orange solid line at 1 shows the ratio of the accretor to itself as a check on the models interpolation; red solid lines show the ratio of the accretor to a nonrotating single star, while the other colors show the ratio to “engineered” stars (see Figure 2, increasing CEB size from blue to yellow; see also Appendix A.1). Each panel shows the ratios at the first time the models reach the radius indicated on the right and by the vertical dotted gray lines. The vertical gray bands mark the radial extent of the CEB in the accretors only, which may differ in the other stars. For the binding energy profiles in the numerator and denominator of the fractions plotted here see Figure 9.⏬ ✎
Other Images in This Article
Copyright and Terms & Conditions
© 2023. The Author(s). Published by the American Astronomical Society.