Image Details
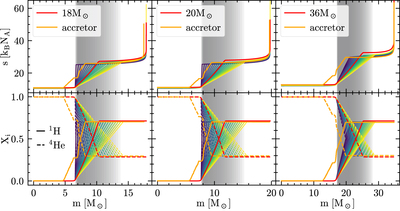
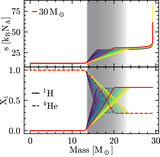
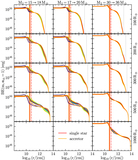
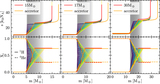
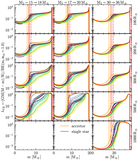
Caption: Figure 2.
Specific entropy s (top row), H (bottom row, solid lines), and He (bottom row, dashed lines) TAMS profiles for nonrotating single stars (red), accretors (orange), and “engineered” models of the same total mass as the post-RLOF mass of the accretors. The overlapping gray bands emphasize the CEB region, X c(1H) + 0.01 < X(1H) < X surf(1H) − 0.01, with X c and X surf the central and surface value of the hydrogen mass fraction. The CEB size of the engineered models increases from blue to yellow.⏬ ✎
Other Images in This Article
Copyright and Terms & Conditions
© 2023. The Author(s). Published by the American Astronomical Society.