Image Details
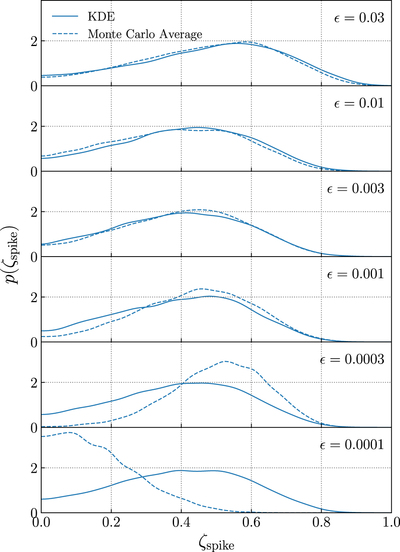
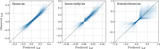
Caption: Figure 12.
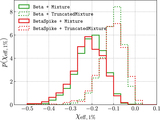
Validation of the KDE likelihood approach discussed in Appendix E. Each subplot shows the marginalized posterior for the fraction of events contained within a narrow spike at χ eff = 0. Solid lines show posteriors computed using the KDE method, while dashed lines show posteriors obtained using ordinary Monte Carlo averaging (Appendix B). Results are shown for a variety of spike widths, from broad spikes with standard deviation ϵ = 0.03 to narrow spikes with ϵ = 10−4. We see that the KDE method yields consistent and convergent results as ϵ approaches zero, while the Monte Carlo averaging gives increasingly divergent results for small spike widths due to growing Monte Carlo errors.
Other Images in This Article
Show More
Copyright and Terms & Conditions
© 2022. The Author(s). Published by the American Astronomical Society.