Image Details
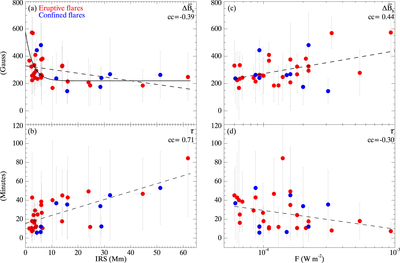
Caption: Figure 5.
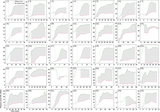
(a)–(b) Scatter plots between two B h -increase parameters and IRS. The solid curve in (a) represents an exponential fitting. The dashed line represents the linear fitting. “cc” indicates the correlation coefficient. (c)–(d) Scatter plots between the parameters and flare magnitude shown for comparison.
Other Images in This Article
Copyright and Terms & Conditions
© 2022. The Author(s). Published by the American Astronomical Society.
Copyright ©
2025 Astronomy Image Explorer. All Rights Reserved.