Image Details
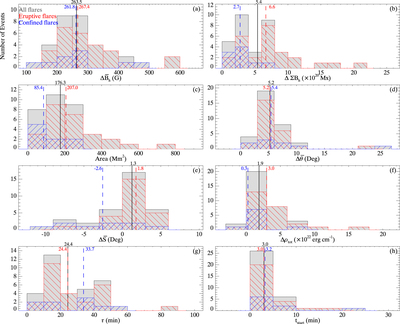
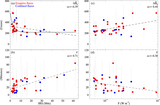
Caption: Figure 3.
Distributions of the postflare change of the B h -increase parameters. In each panel, the vertical lines, with the digits above, mark the parameter medians for the corresponding samples (black, red, and blue for all, eruptive, and confined flares, respectively).
Other Images in This Article
Copyright and Terms & Conditions
© 2022. The Author(s). Published by the American Astronomical Society.
Copyright ©
2026 Astronomy Image Explorer. All Rights Reserved.