Image Details
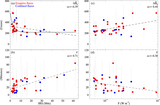
Caption: Figure 2.
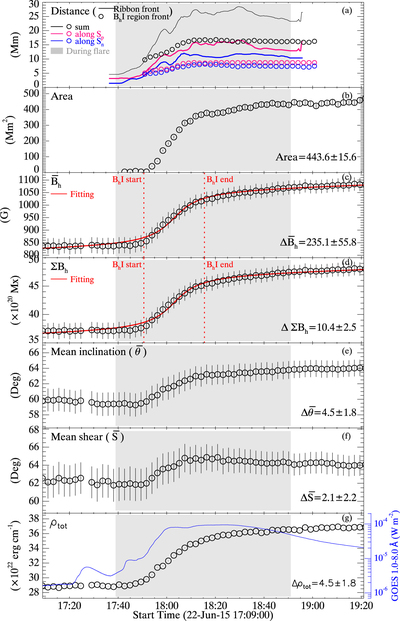
(a) Evolution of distances between the PIL and the fronts of the B h -increase region (circles) and flare ribbons (lines) determined by the slices in Figure 1(a). Distances in both polarities (blue and red) and as sum (black) are shown. (b)–(g) Parameters quantifying the B h increase. The vertical dashed lines in (c) and (d) mark the start and end times of the step-like changes obtained from the fitting. The associated animation lasts from 2017-09-06T17:38 to 2017-09-06T18:56, showing the parameters’ evolution accompanied by the B h -increase region and ribbon evolution. Each frame contains parameter panels (similar as the figure) and two insets of the B h -increase region and flare ribbons (similar as Figures 1(b)–(c)). The frame time is indicated by a vertical line in the parameter panels.
(An animation of this figure is available.)
The video/animation of this figure is available in the online journal.
Other Images in This Article
Copyright and Terms & Conditions
© 2022. The Author(s). Published by the American Astronomical Society.