Image Details
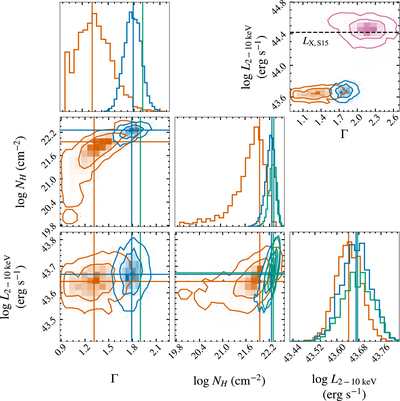
Caption: Figure 3.
Corner plot of results with (a) CABS∗ZWABS∗POW, restrictive prior on Γ (blue); (b) BNSPHERE, physically representative prior on Γ (orange), and (c) CABS∗ZWABS∗POW, fixed Γ = 1.9 (green). Best-fit values for each parameter are shown with a solid line. (Top right) L 2–10 vs. Γ contour with the IR-predicted luminosity shown (Stern 2015, dashed line)—the luminosity contours for the lightly obscured models are decisively below this level. Also shown are the results for the 12% scattered “leaky sphere”, which is closer to predicted (pink).
Other Images in This Article
Copyright and Terms & Conditions
© 2022. The Author(s). Published by the American Astronomical Society.
Copyright ©
2025 Astronomy Image Explorer. All Rights Reserved.