Image Details
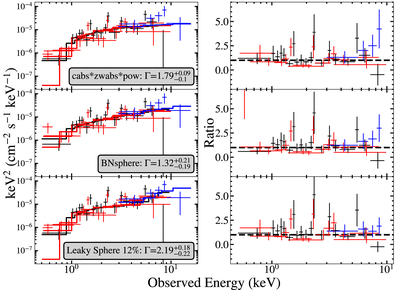
Caption: Figure 2.
Spectra and ratio between data and model for (top) CABS∗ZWABS∗POW, Γ = 1.79; (middle) BNSPHERE, Γ = 1.35; (bottom) “leaky sphere”, Γ = 2.19. Shown is XMM-Newton-pn (black), XMM-Newton-MOS (red), and NuSTAR FPMA (blue), binned to a minimum of 2 counts per bin.
Other Images in This Article
Copyright and Terms & Conditions
© 2022. The Author(s). Published by the American Astronomical Society.
Copyright ©
2025 Astronomy Image Explorer. All Rights Reserved.