Image Details
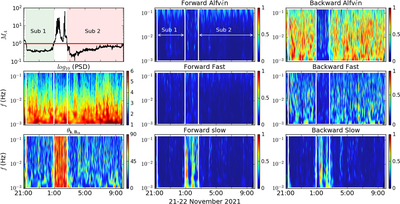
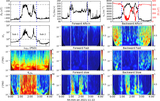
Caption: Figure 4.
MHD wave mode decomposition from 21:00 on November 21 to 10:00 on November 22. The left panels from top to bottom show the Alfvén Mach number M A , the wavelet trace PSD of the magnetic field fluctuations, and the angle between wavevector k and the local mean magnetic field ﹩{\theta }_{{\boldsymbol{k}},{{\boldsymbol{B}}}_{0l}}﹩. The other six panels show the relative fraction of the spectral energy density in each MHD wave mode.
Other Images in This Article
Copyright and Terms & Conditions
© 2022. The Author(s). Published by the American Astronomical Society.
Copyright ©
2025 Astronomy Image Explorer. All Rights Reserved.