Image Details
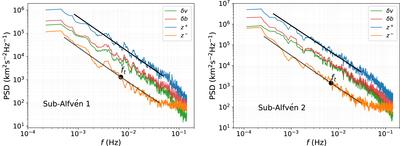
Caption: Figure 3.
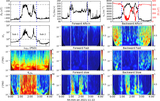
Power spectral density (PSD) of the Elsässer variables z ±, velocity fluctuations δ v , and magnetic fluctuations in Alfvén units δ b . The left and right panels correspond to the first and second sub-Alfvénic interval observed in E10, respectively. The black lines in each panel represent the theoretical spectra predicted by the NI MHD turbulence model, and f t denotes the transition frequency at which the z − spectrum flattens in the inertial range.
Other Images in This Article
Copyright and Terms & Conditions
© 2022. The Author(s). Published by the American Astronomical Society.