Image Details
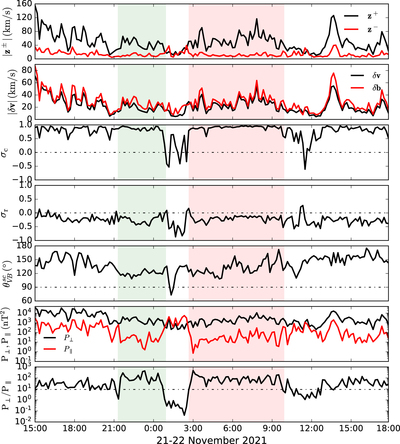
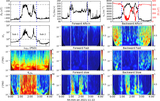
Caption: Figure 2.
Time profiles of the solar wind turbulence parameters during the crossing of the sub-Alfvénic flow in E10. The two sub-Alfvénic solar wind intervals are indicated by the shaded areas as Figure 1. From top to bottom, the panels show the amplitude of the Elsässer variables z ±, amplitude of the velocity fluctuations δ v and magnetic field fluctuations in Alfvén units δ b , normalized cross-helicity σ c , normalized residual energy σ r , the angle between the mean magnetic field and mean velocity field in the spacecraft frame ﹩{\theta }_{\mathrm{VB}}^{\mathrm{sc}}﹩, the transverse P ⊥ and longitudinal P ∥ magnetic fluctuation power, and the magnetic fluctuation power anisotropy P ⊥/P ∥.
Other Images in This Article
Copyright and Terms & Conditions
© 2022. The Author(s). Published by the American Astronomical Society.