Image Details
Caption: Figure 1.
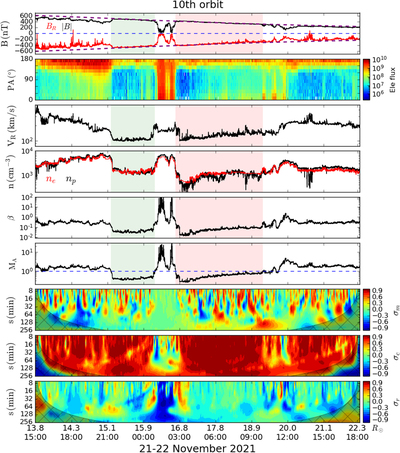
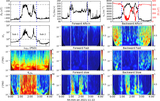
Solar wind parameters observed by PSP during E10. Panels from top to bottom show the magnetic field radial component B R (red line), magnitude ∣B∣ (black line), and the 1/r 2 field scaling (purple dashed line) predicted by the Parker spiral model, PAD of 526 eV superthermal electrons from SPAN-E, solar wind proton radial speed V R , proton density n p from SPAN-I (black line) and electron density n e from the QTN spectrum (red line), proton plasma beta β, and radial Alfvén Mach number M A ; and the spectrogram of the normalized reduced magnetic helicity σ m , normalized cross-helicity σ c , and normalized residual energy σ r . The shaded cross areas in the bottom three panels are determined by the cone of influence (COI) during the wavelet transform. Scales larger than the COI are subject to edge effects and are not reliable. The two sub-Alfvénic solar wind intervals are indicated by green and pink shaded areas, respectively.
Other Images in This Article
Copyright and Terms & Conditions
© 2022. The Author(s). Published by the American Astronomical Society.