Image Details
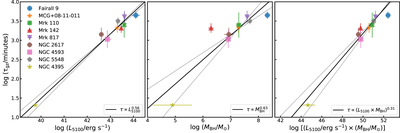
Caption: Figure 3.
Rest-frame interband lag τ gz as a function of AGN continuum luminosity at 5100 Å (left), BH mass (middle), and the product L × M BH (right). The g –z lags of eight local AGN are from literature sources as described in the text. The AGN continuum luminosities and black hole masses for the comparison sample are from Bentz & Katz (2015). The quantity L 5100 refers to λ L λ at 5100 Å. For NGC 4395, the horizontal error bar on M BH denotes the range spanning 1.7 × 10⁴ to 4 × 10⁵ M ⊙ corresponding to the mass measurements from Cho et al. (2021) and den Brok et al. (2015). The black solid and dotted lines in each panel denote the power-law model fit and its 1σ uncertainty range.
Other Images in This Article
Copyright and Terms & Conditions
© 2022. The Author(s). Published by the American Astronomical Society.