Image Details
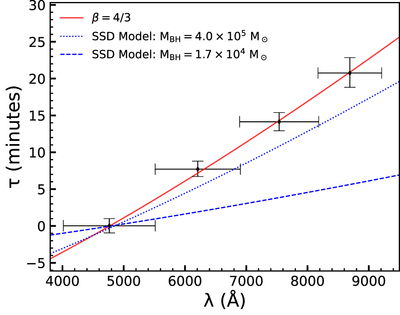
Caption: Figure 2.
Lags as a function of wavelength in the rest frame of NGC 4395, from the combined Night 1 + Night 2 data. Horizontal error bars denote the width of each filter. The β = 4/3 power-law fit to the riz data points is shown as a red curve. Blue dashed and dotted curves represent SSD lag–wavelength models calculated for BH masses of 1.7 × 10⁴ and 4 × 10⁵ M ⊙, respectively.
Other Images in This Article
Copyright and Terms & Conditions
© 2022. The Author(s). Published by the American Astronomical Society.
Copyright ©
2026 Astronomy Image Explorer. All Rights Reserved.