Image Details
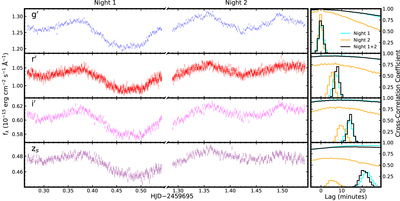
Caption: Figure 1.
NGC 4395 light curves and cross-correlation lags. Left: MuSCAT3 light curves in the griz bands. Right: cross-correlation results for each band, measured relative to the g band. Each panel shows cross-correlation functions (curves across the upper portion of the panel) and cross-correlation centroid distributions (histograms, renormalized to arbitrary units) for the data from Night 1 and from Night 2 separately, and for the combined Night 1 + Night 2 light curves. The g-band panel displays the autocorrelation functions and autocorrelation centroid distributions of the g-band light curves.
Other Images in This Article
Copyright and Terms & Conditions
© 2022. The Author(s). Published by the American Astronomical Society.
Copyright ©
2025 Astronomy Image Explorer. All Rights Reserved.