Image Details
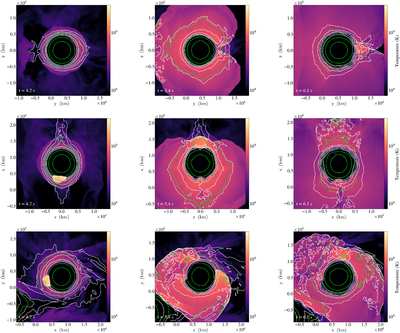
Caption: Figure 2.
Density (white) and pressure (lime) contours overlaid on 2D temperature slice plots along the X = 0 (top row) midplane, and corresponding planes along the Y (middle row) and Z (bottom row) at times (4.2, 5.4, 6.1) s for a resolution of 17 km.
Other Images in This Article
Copyright and Terms & Conditions
© 2022. The Author(s). Published by the American Astronomical Society.
Copyright ©
2025 Astronomy Image Explorer. All Rights Reserved.