Image Details
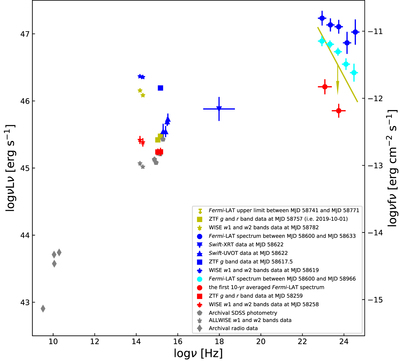
Caption: Figure 4.
The broadband SED of GB6 J2113+1121. Simultaneous data are colored. The blue ones represent the high-flux state and the red ones correspond to the low-flux state. The 1 yr averaged γ-ray spectrum corresponding to the long-term high-flux state is plotted in cyan symbols. Multiwavelength data of GB6 J2113+1121 that are strictly simultaneous with the neutrino arrival are also plotted (in yellow). Nonsimultaneous data are in gray.
Other Images in This Article

Copyright and Terms & Conditions
© 2022. The Author(s). Published by the American Astronomical Society.
Copyright ©
2025 Astronomy Image Explorer. All Rights Reserved.