Image Details
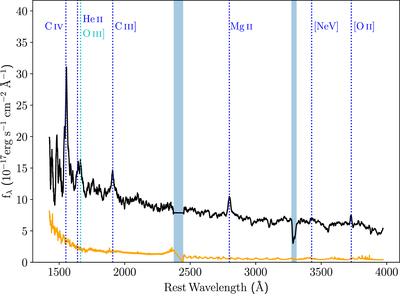
Caption: Figure 3.
P200 spectrum. The spectrum is plotted in black and smoothed by a window with a length of 16 Å, while the uncertainty is in orange. The vertical dotted lines mark the main emission lines. The blue shaded regions represent the position of the dichroic or the uncorrected telluric.
Other Images in This Article

Copyright and Terms & Conditions
© 2022. The Author(s). Published by the American Astronomical Society.
Copyright ©
2025 Astronomy Image Explorer. All Rights Reserved.