Image Details
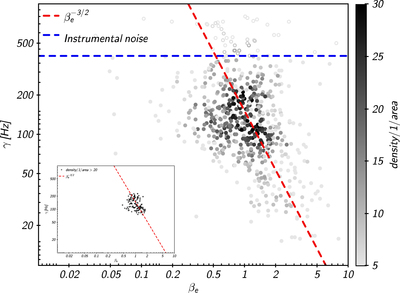
Caption: Figure 3.
Scatter plot of the density of points in the plane (βe, γ) for the N = 631 samples selected by the data set of the Cluster spacecraft. A power law ﹩{\beta }_{e}^{-3/2}﹩ is reported as a dashed red line. The 400 Hz noise floor (Alexandrova et al. 2012) is marked by a blue dashed horizontal line: points corresponding to γ values above (below) it are displayed as open (filled) signs. The γ values have been obtained for all samples from best fits of Equation (3). For each γ, the corresponding value of βe is measured from the parameters of the sample. In the inset figure we plot the plane (βe, γ) by using only a density of points ≥20.
Other Images in This Article
Copyright and Terms & Conditions
© 2022. The Author(s). Published by the American Astronomical Society.