Image Details
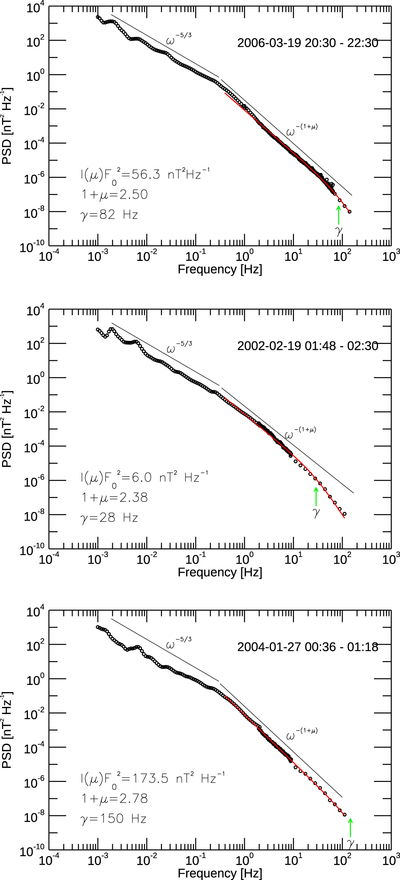
Caption: Figure 1.
Examples of magnetic energy density spectra obtained from three different 30 minute long samples selected from the data set of the Cluster spacecraft (the referenced time interval which identifies each sample is reported on the different panels). The fit with relation (3), beyond the ionic break, is shown in red and best-fit parameters are reported on the plots. As a reference, we also plot the power laws ω−5/3 in the inertial range, and ω−(1+μ) beyond the ionic break, respectively. The value of the frequency γ is shown with the green arrows.
Other Images in This Article
Copyright and Terms & Conditions
© 2022. The Author(s). Published by the American Astronomical Society.
Copyright ©
2025 Astronomy Image Explorer. All Rights Reserved.