Image Details
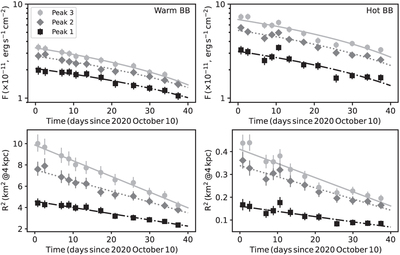
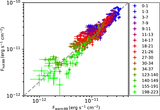
Caption: Figure 5.
Temporal evolution of the warm BB (left panels) and hot BB (right panels) for each of the three peaks in the SGR 1830−0645 pulse profile. The upper panels show the 1–10 keV flux decay while the lower panels display their corresponding area evolution. The lines are best-fit linear decay trends. Note that the vertical axes of the upper panels are logarithmic. The constant separations between the lines indicate a similar fractional change in each peak. See text for more details.
Other Images in This Article
Copyright and Terms & Conditions
© 2022. The Author(s). Published by the American Astronomical Society.
Copyright ©
2025 Astronomy Image Explorer. All Rights Reserved.