Image Details
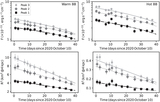
Caption: Figure 4.
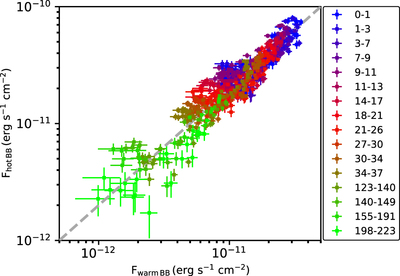
Hot BB vs. warm BB fluxes derived from our phase-resolved spectroscopic analysis, color-coded by time interval (in days) during which the analysis is performed. An obvious linear correlation exists between the fluxes of each component throughout the outburst following Fhot BB ∝ 2 × Fwarm BB, shown as a dashed gray line.
Other Images in This Article
Copyright and Terms & Conditions
© 2022. The Author(s). Published by the American Astronomical Society.
Copyright ©
2025 Astronomy Image Explorer. All Rights Reserved.