Image Details
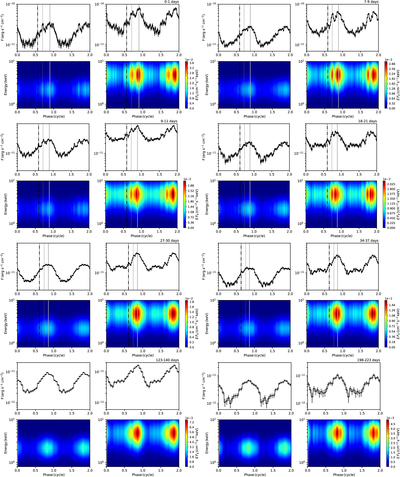
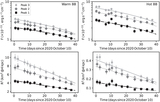
Caption: Figure 3.
Sample dynamic spectral profiles of SGR 1830−0645 derived by fitting 50 phase bins with an absorbed double-blackbody model. Panel tetrads show the integrated fluxes (upper panels) and the νFν photon flux contours in the phase-energy diagram (lower panels) for the warm BB (left) and hot BB (right) spectral components. The time interval for each is noted in the upper-right corner as days from outburst onset. The vertical lines indicate the best-fit Gaussian centroids to the count pulse peaks for each interval. The last row is for two intervals during the post-Sun-constrained period. The analysis is performed for 20 phase bins to increase S/N. See text for more details.
Other Images in This Article
Copyright and Terms & Conditions
© 2022. The Author(s). Published by the American Astronomical Society.