Image Details
Caption: Figure 1.
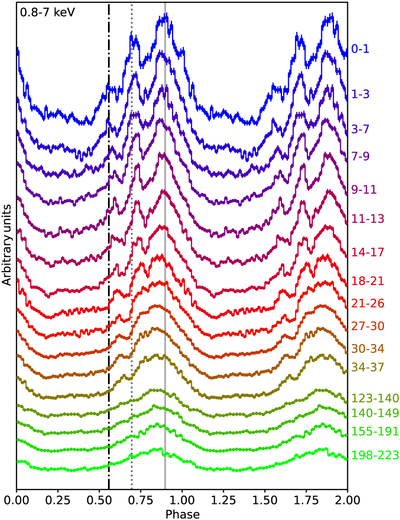
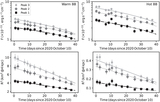
The 0.8–7 keV pulse profile evolution of SGR 1830−0645 with time. The black dotted–dashed, dark-gray dotted, and light-gray solid lines represent the Gaussian centroids of the three peaks during the first day of outburst. A shift, toward the right for the two weaker peaks and the left for the brightest peak, is evident. This shift produces a simpler, nearly sinusoidal, pulse shape four months after outburst onset. The numbers to the right indicate the intervals, in days from outburst onset, that were used to derive each pulse. Adapted from Y21.
Other Images in This Article
Copyright and Terms & Conditions
© 2022. The Author(s). Published by the American Astronomical Society.
Copyright ©
2025 Astronomy Image Explorer. All Rights Reserved.