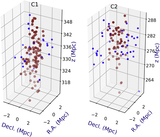
Image Details
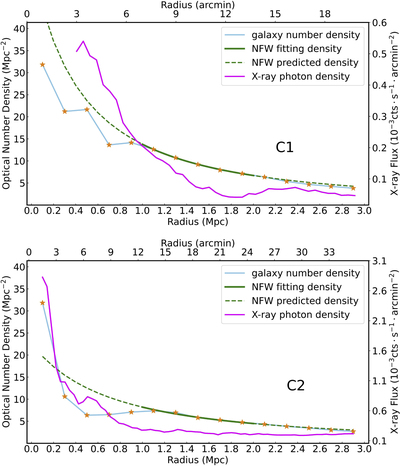
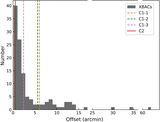
Caption: Figure 5.
Galaxy number densities (shown as stars) as a function of radius. The magenta curve shows the X-ray photon number profile (units are labeled on the right). The green solid line is the best fit of the NFW model profile using the data points between 1 and 2 Mpc. The green dashed line is prediction from the best fit.
Other Images in This Article

Copyright and Terms & Conditions
© 2022. The Author(s). Published by the American Astronomical Society.
Copyright ©
2026 Astronomy Image Explorer. All Rights Reserved.